Dashboards |
|
|---|
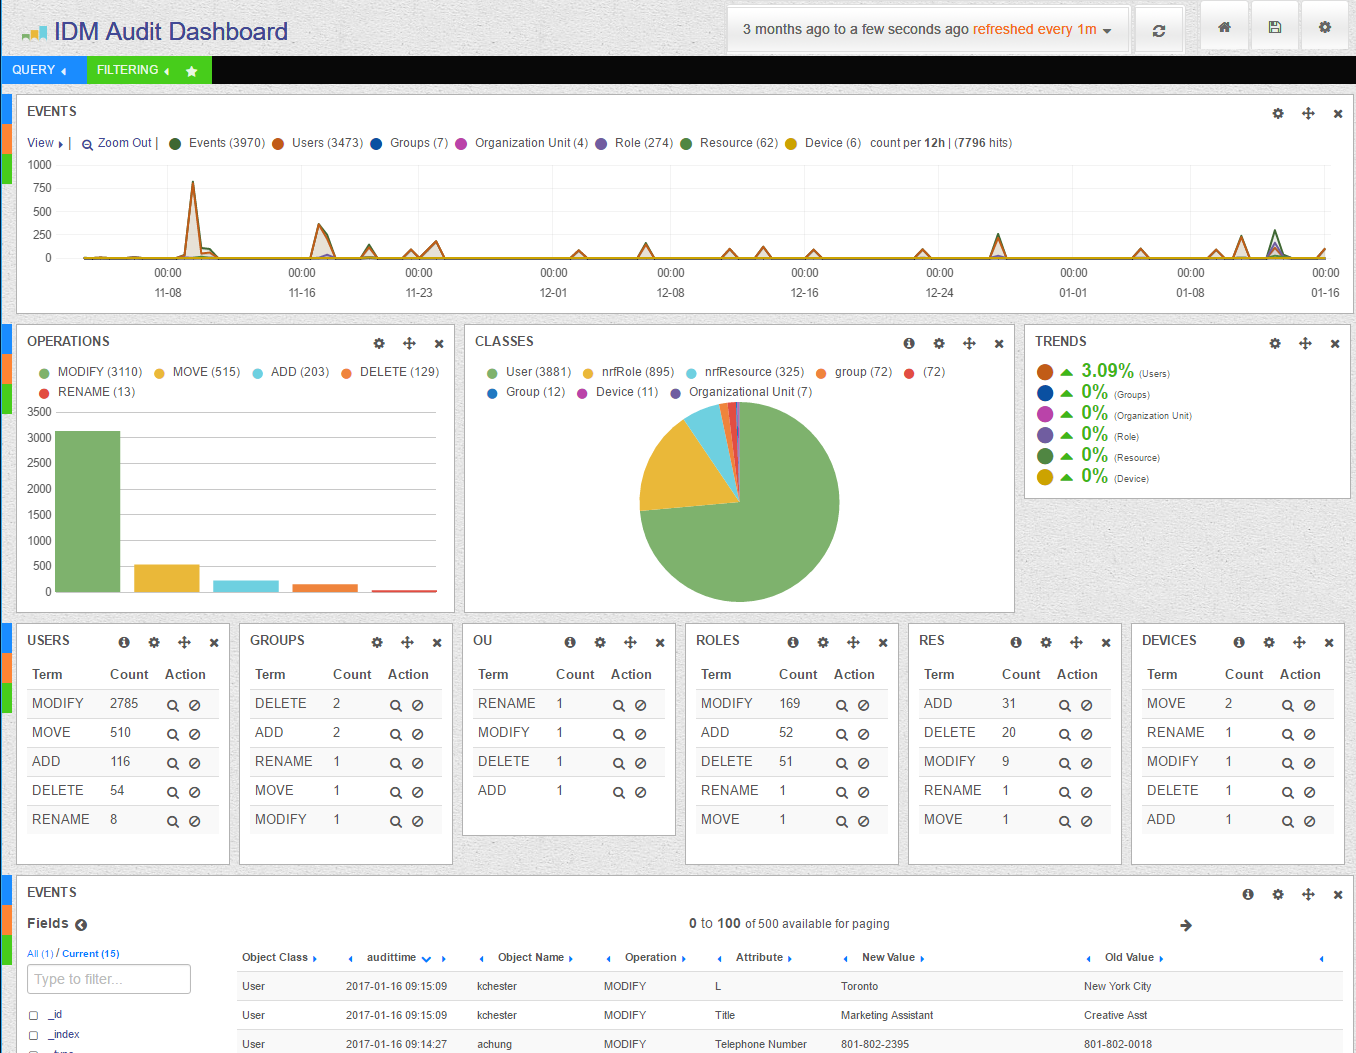 | Audit DashboardThe "Audit Dashboard" shows all events that have taken place in a specific period of time within your IDM engine. The information is arranged in comprehensible parts: - EVENTS: a histogram shows all events on different objects in a imteline
- OPERATIONS: how often have the different operations taken place (add, modify, move, rename, delete)
- CLASSES: which object classes has been processed how often
- TRENDS: is there a specific trend on a specific class to have more or less events
- USERS: amount of different operations on object class "User"
- GROUPS: amount of different operations on object class "Group"
- OU: amount of different operations on object class "Organizational Unit"
- ROLES: amount of different operations on object class "nrfRoles"
- RESOURCES: amount of different operations on object class "nrfResources"
- DEVICES: amount of different operations on object class "device"
- EVENTS TABLE: The event table at the bottom shows every event in detail: date, time, object type, attribute, operation, old and new attribute values, modifier and much more.
|
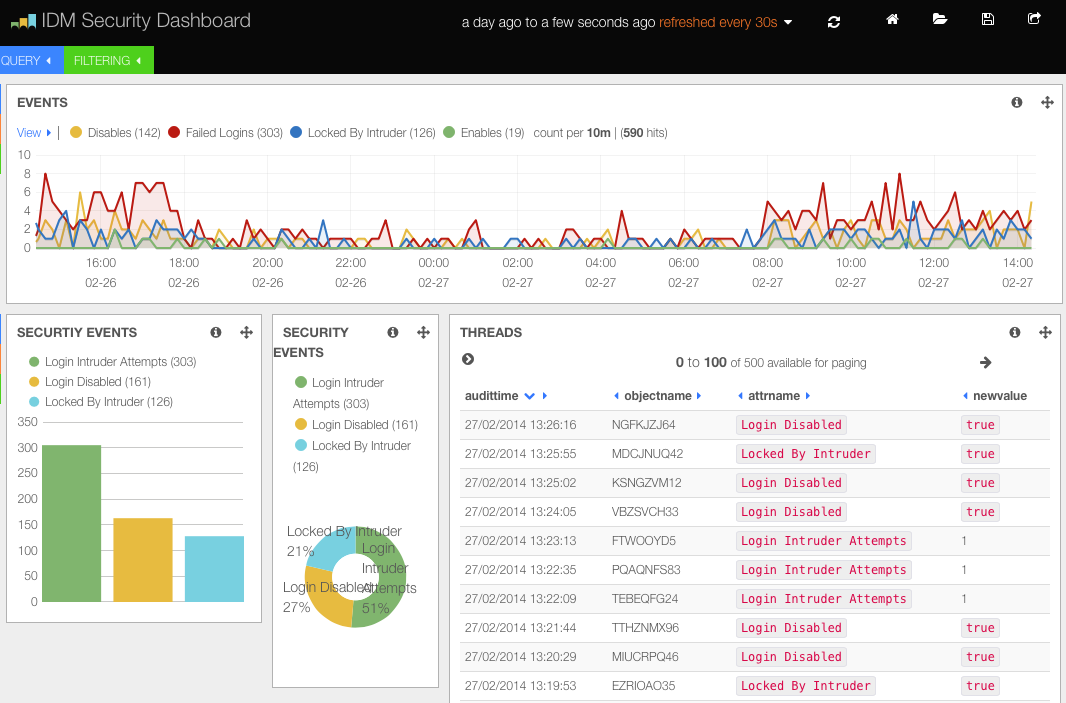 | Security DashboardThe "Security Dashboard" identifies security relevant events. These are especially enabling or disabling of users, intruder detection, and failed logins. The different graphs illustrate - EVENTS: all security relevant events on a timelime
- SECURITY BREACHES: possible security breaches by enabling logins, failed logins or locked by intruder detection
- STATISTICS: amount of different possible security breaches
- TRENDS: is there a specific trend in possible security breaches
- THREADS: all events in details that could lead to a security breach
|
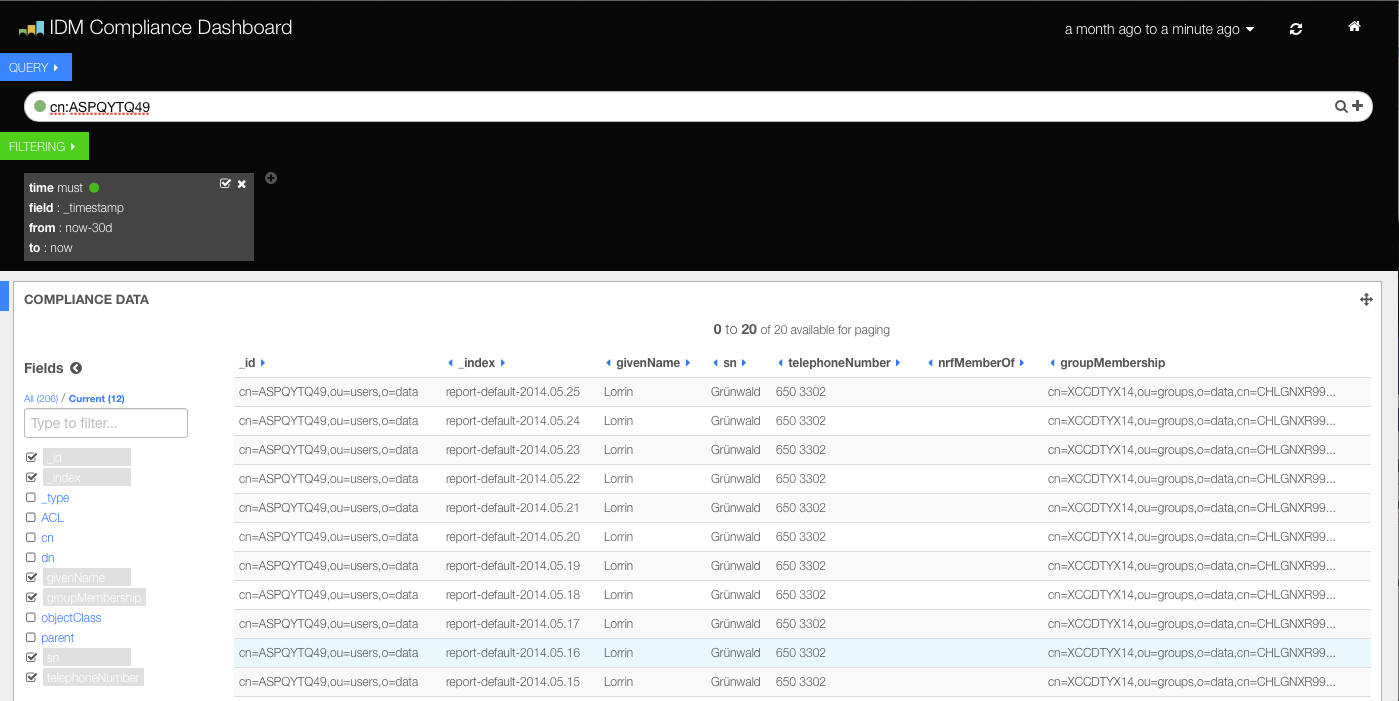 | Compliance DashboardThe "Compliance Dashboard" enables the comparison of attribute values at different dates. - QUERY: search for specific objects by common name
- FILTERING: predefined filter to easily select between different object classes
- COMPLIANCE DATA: see all data in different time periods, that is available for your searched objects
|
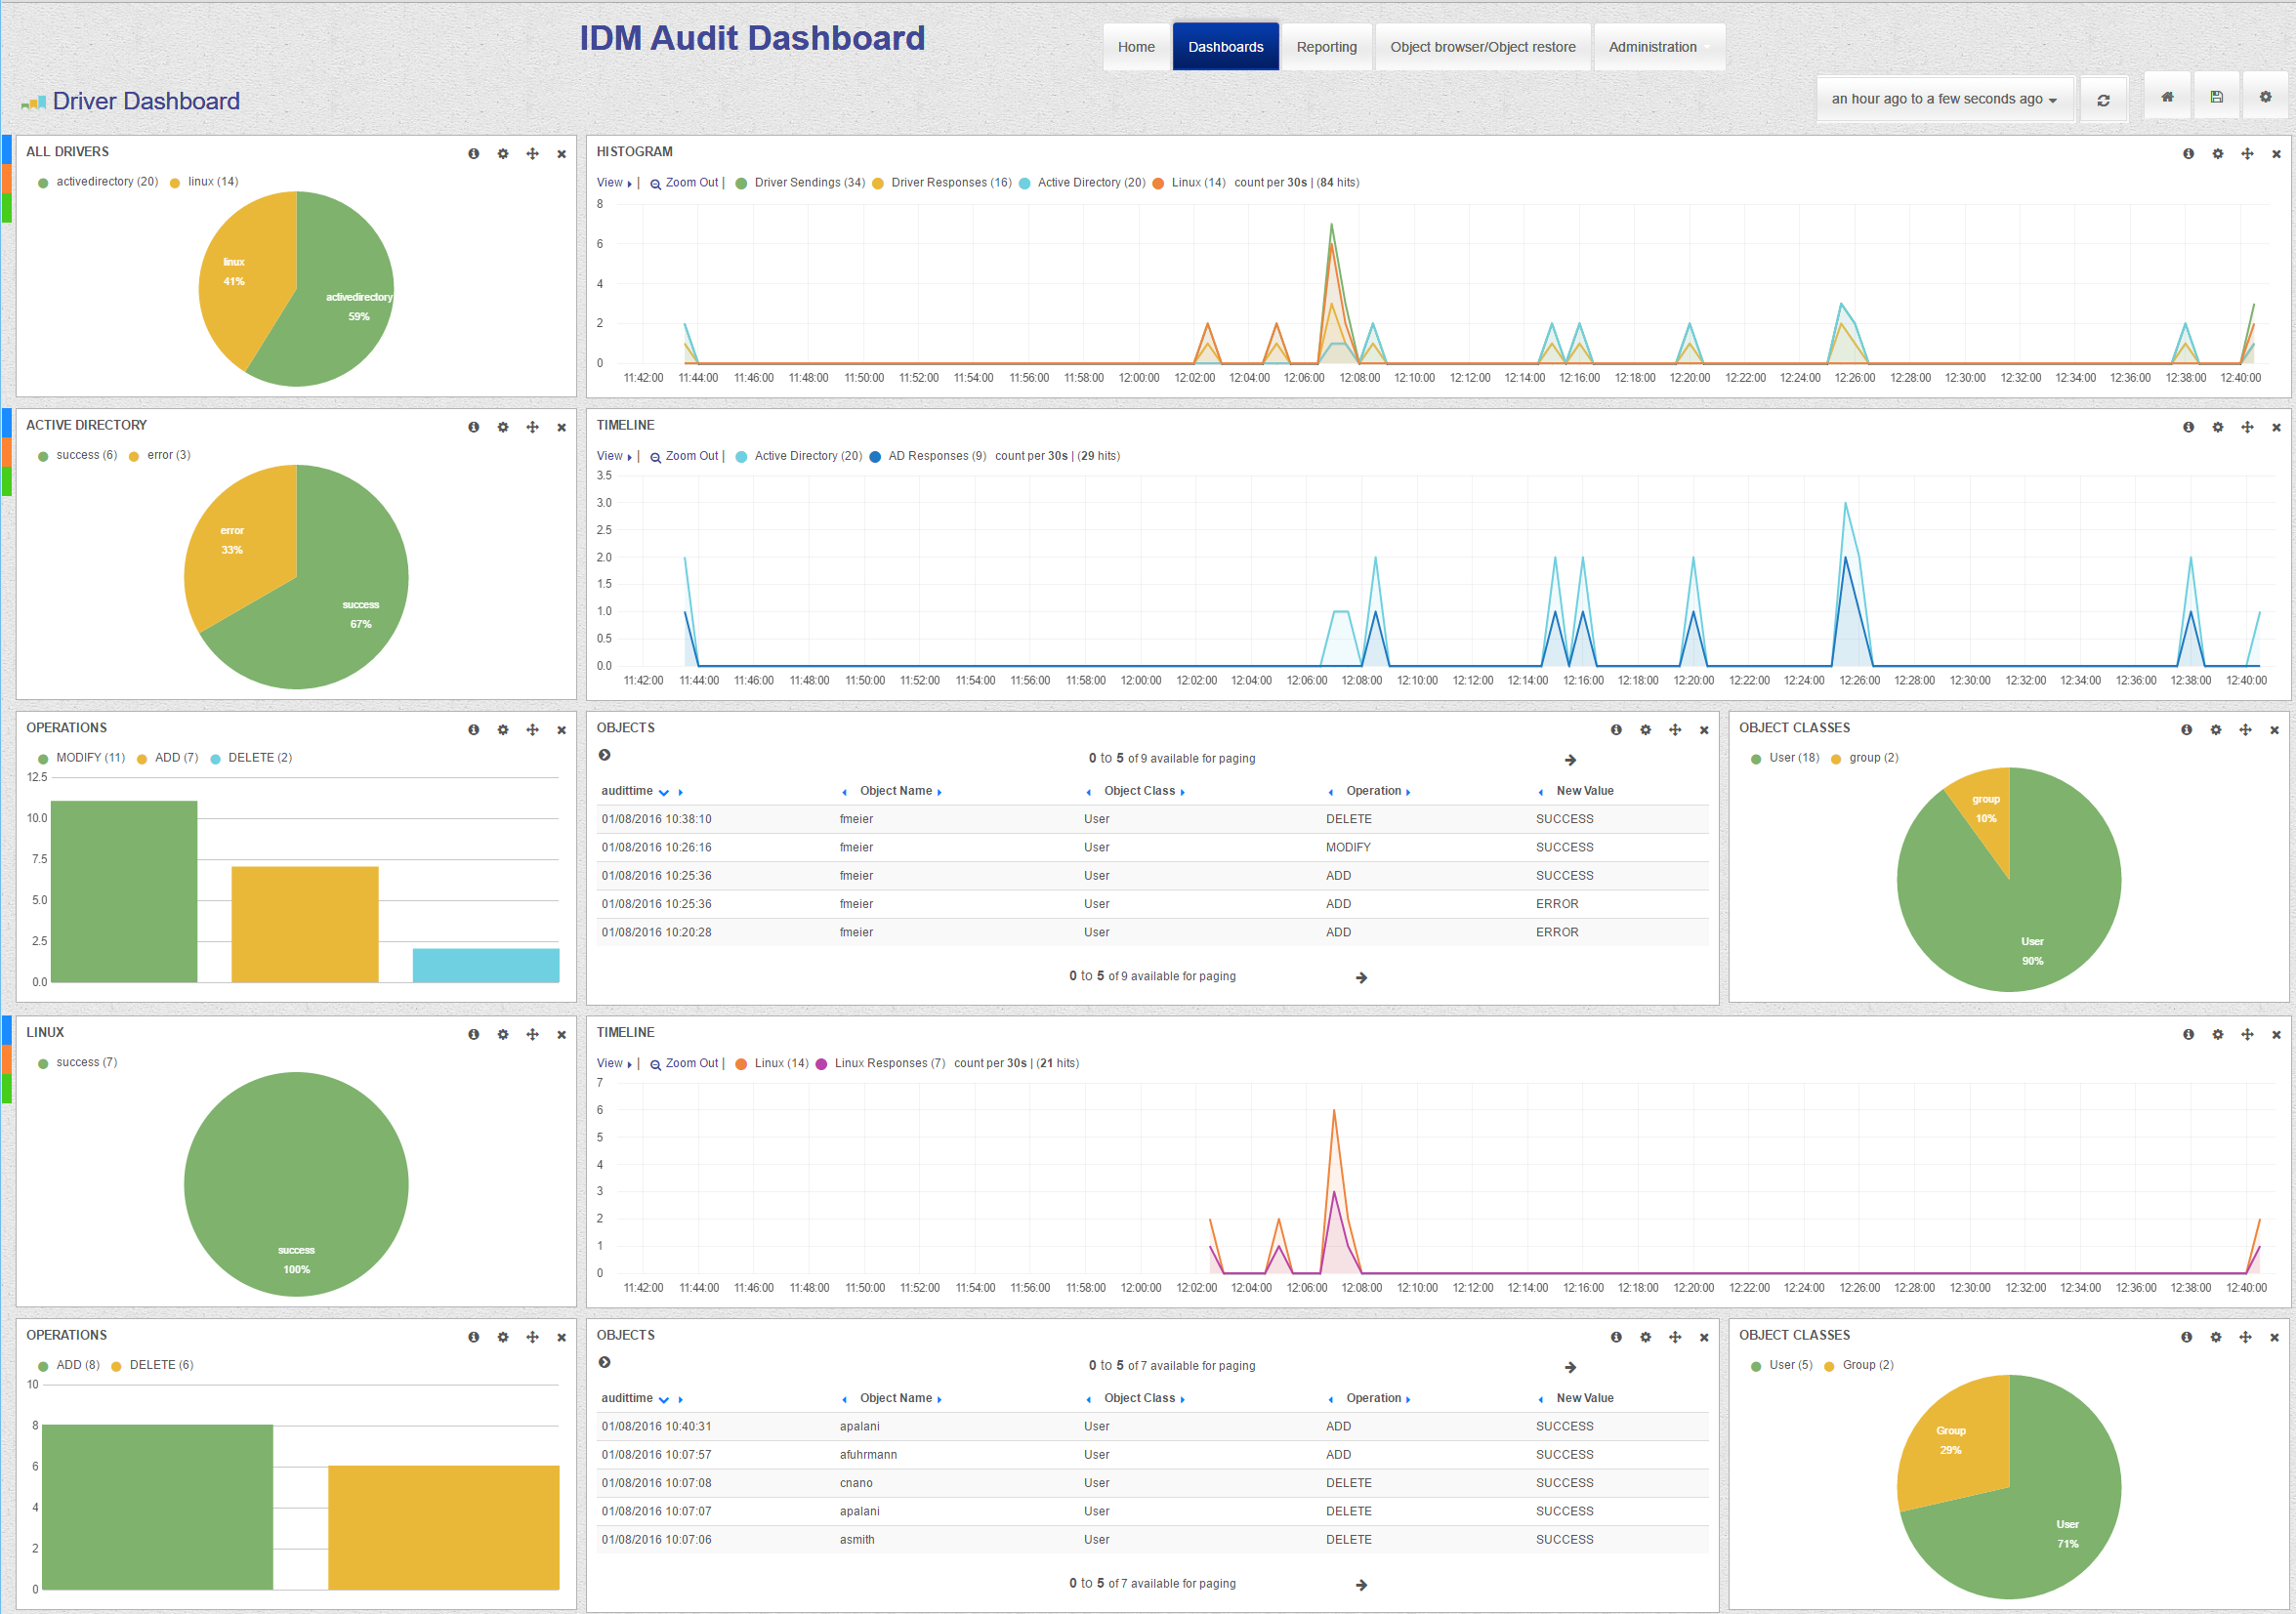 | Driver DashboardThe driver dashboard shows in detail every event, that has been processed by a driver either by the subscriber, the publisher or both channels. It also presents a summary of all events processed by the drivers. Summary- pie chart of the amount of processed events by each driver
- histogramm all driver events including sends and system responses
per driver- pie chart with summary of all messages received from the target system
- histogramoff all driver sends and system responses
- bar chart of all different events (add, modify, rename, move, delete)
- pie chart of the different object classes
- detailed list of all processed objects
|
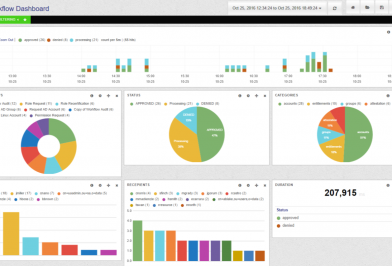 | Workflow DashboardThe workflow dashboard presents a detailed graphic about every worklfow that has been processed by the system. You see - a histogramm with all processing, denied or approved workflows
- a pie chart with the amount of all worklfows that has been startet in a specific timeframe
- the status of all workflows started in the defined timeframe
- a pie chart of the different workflow categories
- the main initiators of workflows and amount of workflow they have started
- the main recipients of workflows and the amount of workflows started for these recipients
- the average duration of all workflows, approved or denied workflows
|